On Graphvix - Part 9
Ranking
The final1 piece of the Graphvix spec to look at is the ability to rank nodes and subgraphs in order to enforce vertical or horizontal hierarchies in a graph. The functionality to make this happen is actually already in Graphvix, but since it can be such an important piece of structuring a graph, I wanted to call a bit of extra attention to it.
This post is part of a series:
- Part 1 - The over engineering-ing
- Part 2 - A :digraph primer
- Part 3 - IDs
- Part 4 - A first API
- Part 5 - Global settings
- Part 6 - Subgraphs
- Part 7 - Records
- Part 8 - Records API
- Part 9 - Ranking
- Postscript - HTML Records
As an example, let’s draw a very simple family tree, with years of birth, of my immediate family. To do this, we need to make sure a timeline of years is ordered correctly along the left side, and that each family member is aligned with their birth year. Let’s begin by creating the vertices:
g = Graph.new
{g, y53} = Graph.add_vertex(g, "1953")

{g, y56} = Graph.add_vertex(g, "1956")
{g, y78} = Graph.add_vertex(g, "1978")

{g, y79} = Graph.add_vertex(g, "1979")
{g, y85} = Graph.add_vertex(g, "1985")
{g, y89} = Graph.add_vertex(g, "1989")
{g, y2015} = Graph.add_vertex(g, "2015")
{g, y2018} = Graph.add_vertex(g, "2018")
{g, michael} = Graph.add_vertex(g, "Michael") # myself
{g, lauren} = Graph.add_vertex(g, "Lauren") # wife
{g, rachel} = Graph.add_vertex(g, "Rachel") # sister
{g, corey} = Graph.add_vertex(g, "Corey") # brother-in-law
{g, howard} = Graph.add_vertex(g, "Howard") # father
{g, jessi} = Graph.add_vertex(g, "Jessi") # mother
{g, h_and_j} = Graph.add_vertex(g, "Howard + Jessi")
{g, l_and_m} = Graph.add_vertex(g, "Lauren + Michael")
{g, r_and_c} = Graph.add_vertex(g, "Rachel + Corey")
Then we create the edges necessary to order the timeline
{g, _} = Graph.add_edge(g, y53, y56)
{g, _} = Graph.add_edge(g, y56, y78)
{g, _} = Graph.add_edge(g, y78, y79)
{g, _} = Graph.add_edge(g, y79, y85)
{g, _} = Graph.add_edge(g, y85, y89)
{g, _} = Graph.add_edge(g, y89, y2015)
{g, _} = Graph.add_edge(g, y2015, y2018)
Now we create a set of subgraphs, each containing a year vertex and the vertex or vertices of births or marriages that occurred in that year. We give each subgraph a property of rank=same to print all the vertices in the subgraph at the same rank:
{g, _} = Graph.add_subgraph(g, [y53, howard], rank: "same")

{g, _} = Graph.add_subgraph(g, [y56, jessi], rank: "same")
{g, _} = Graph.add_subgraph(g, [y78, lauren], rank: "same")
{g, _} = Graph.add_subgraph(g, [y79, h_and_j], rank: "same")
{g, _} = Graph.add_subgraph(g, [y85, michael], rank: "same")
{g, _} = Graph.add_subgraph(g, [y89, rachel, corey], rank: "same")
{g, _} = Graph.add_subgraph(g, [y2015, r_and_c], rank: "same")
{g, _} = Graph.add_subgraph(g, [y2018, l_and_m], rank: "same")
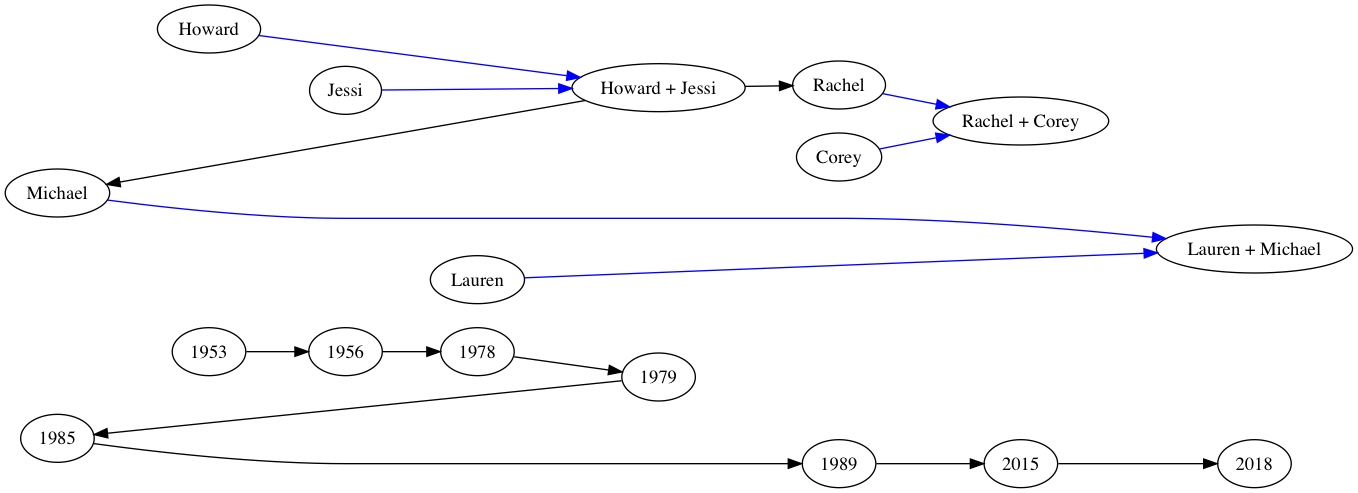
And, finally, we add edges to show relationships. Blue represents a partner in a marriage, and black represents a parent -> child relationship.
{g, _} = Graph.add_edge(g, howard, h_and_j, color: "blue")
{g, _} = Graph.add_edge(g, jessi, h_and_j, color: "blue")
{g, _} = Graph.add_edge(g, h_and_j, michael)
{g, _} = Graph.add_edge(g, h_and_j, rachel)
{g, _} = Graph.add_edge(g, rachel, r_and_c, color: "blue")

{g, _} = Graph.add_edge(g, corey, r_and_c, color: "blue")
{g, _} = Graph.add_edge(g, lauren, l_and_m, color: "blue")

{g, _} = Graph.add_edge(g, michael, l_and_m, color: "blue")
Let’s take a look at the resulting graph:
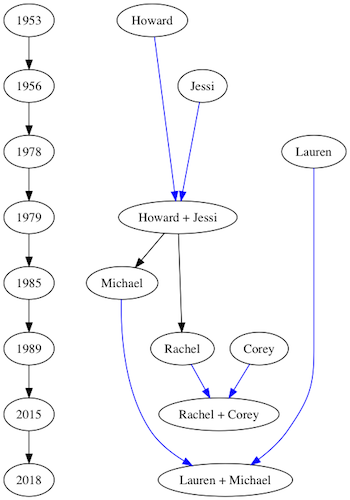
Not the prettiest graph in the world, but it does what we set out to have it do. For the most part, that’s all there really is to ranks in DOT. But, in addition to the rank of same, we can pass in min, max, source or sink. Using our example above, we can see what effect these ranks have.
If a subgraph’s rank is set to min, every vertex in the subgraph will be on at least as low* a rank as any other vertex in the graph.
*In this instance, low is relative to the rank direction of the graph. The default is top-to-bottom, so a lower rank is towards the top of the graph.
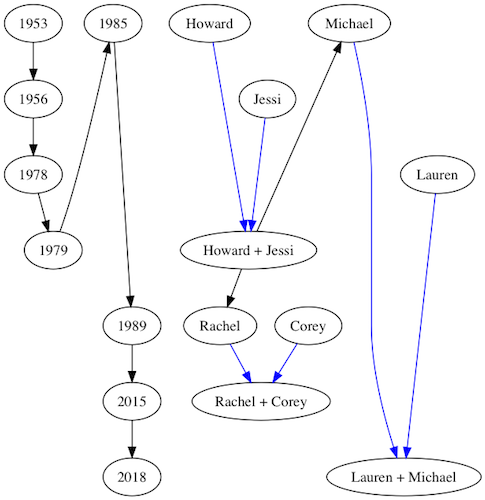
For example, if I wanted my own name to be at least as high on the graph as anything else, I could change the line to read
{g, _} = Graph.add_subgraph(g, [y85, michael], rank: "min”)
And the resulting graph looks like
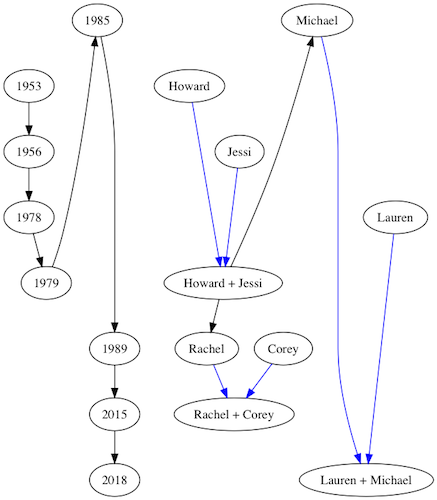
If I wanted my name to be at a lower rank than any others, I would use source instead of min, resulting in the graph below:
max and sink, work analogously to min and source respectively, but in the opposite direction, ensuring a rank higher than (or equal to, in the case of max) any other vertex in the graph.
rankdir
As I said above, the default direction for graph ranking is top-to-bottom. This can be set explicitly by adding a global property of rankdir=TB to the graph2
Graph.set_graph_property(g, :rankdir, "TB")
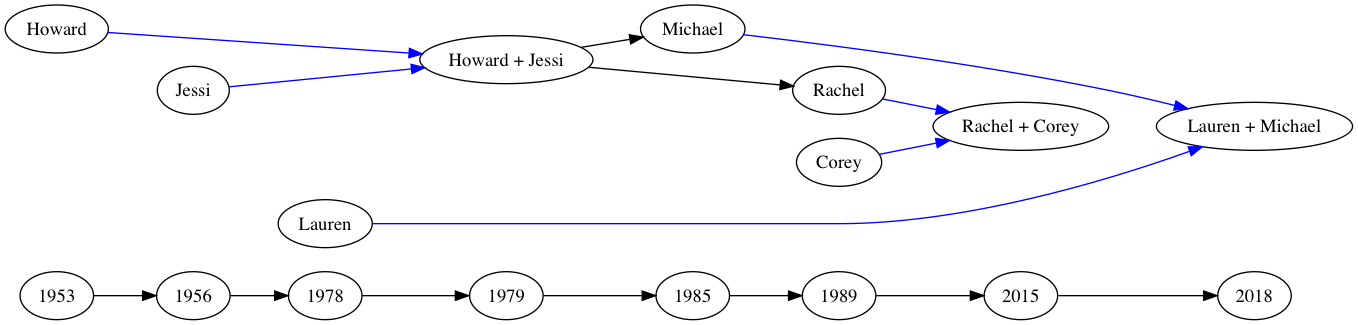
This results in a graph that looks identical to our first graph. As you could probably guess, there are four values for rankdir: TB, BT, LR and RL. These behave as you might expect. For example, here is what our family tree looks like with rankdir=LR
And, if we were to set rank=source for my name and birth year, we see, again that the subgraph is shifted to the lowest possible rank, relative to the new rankdir:
And with that, we’ve reached the end of my series on Graphvix. We started with an overly complex library using GenServers to hew too close to a traditional object oriented approach to the problem, and have ended with a library that not only has more functionality than our original, but also works much more in the style and spirit of Elixir. Thank you for joining me on this journey.
This is far from a complete survey of the DOT language syntax. There are properties for graphs, subgraphs, nodes and edges that I have not touched on in this series. However, they can be added, just as the properties we have looked at, using the API we have written. A more complete overview of the DOT language, which I used as a resource while writing Graphvix and this blog series, can be found as a PDF here.
-
Not actually the final post. There will be a postscript on HTML-style records following this. ↩
-
This function, and the associated functions to display these properties, need to be created at this point, an oversight on my part earlier in the implementation. However, as they have much in common with other functions which already exist, there is little need to describe them in any detail. The
Graphvixcode containing these additions can be found tagged here. ↩