Alphabet Project, Part 4
Previous entries in this series:
Step 4 - adding musicality
Before we move out of the purely generative phase of this project, there is one more dataset that needs to be taken into account. A friend responded to my first blog post asking about factoring in overall letter frequency. The original graphs show only letter distribution, with the color of the curve mapping to an overall frequency legend at the bottom of the chart.
It’s a good question, and one I’d thought about without coming to any specific conclusion. I couldn’t find anywhere to fit in those frequencies in the original polyrhythm generation, and I had hoped an answer would make itself known once I had a score to look at.
And, lo and behold, an answer did present itself after working through the various polyryhthm generators (see Part 3 of the series)
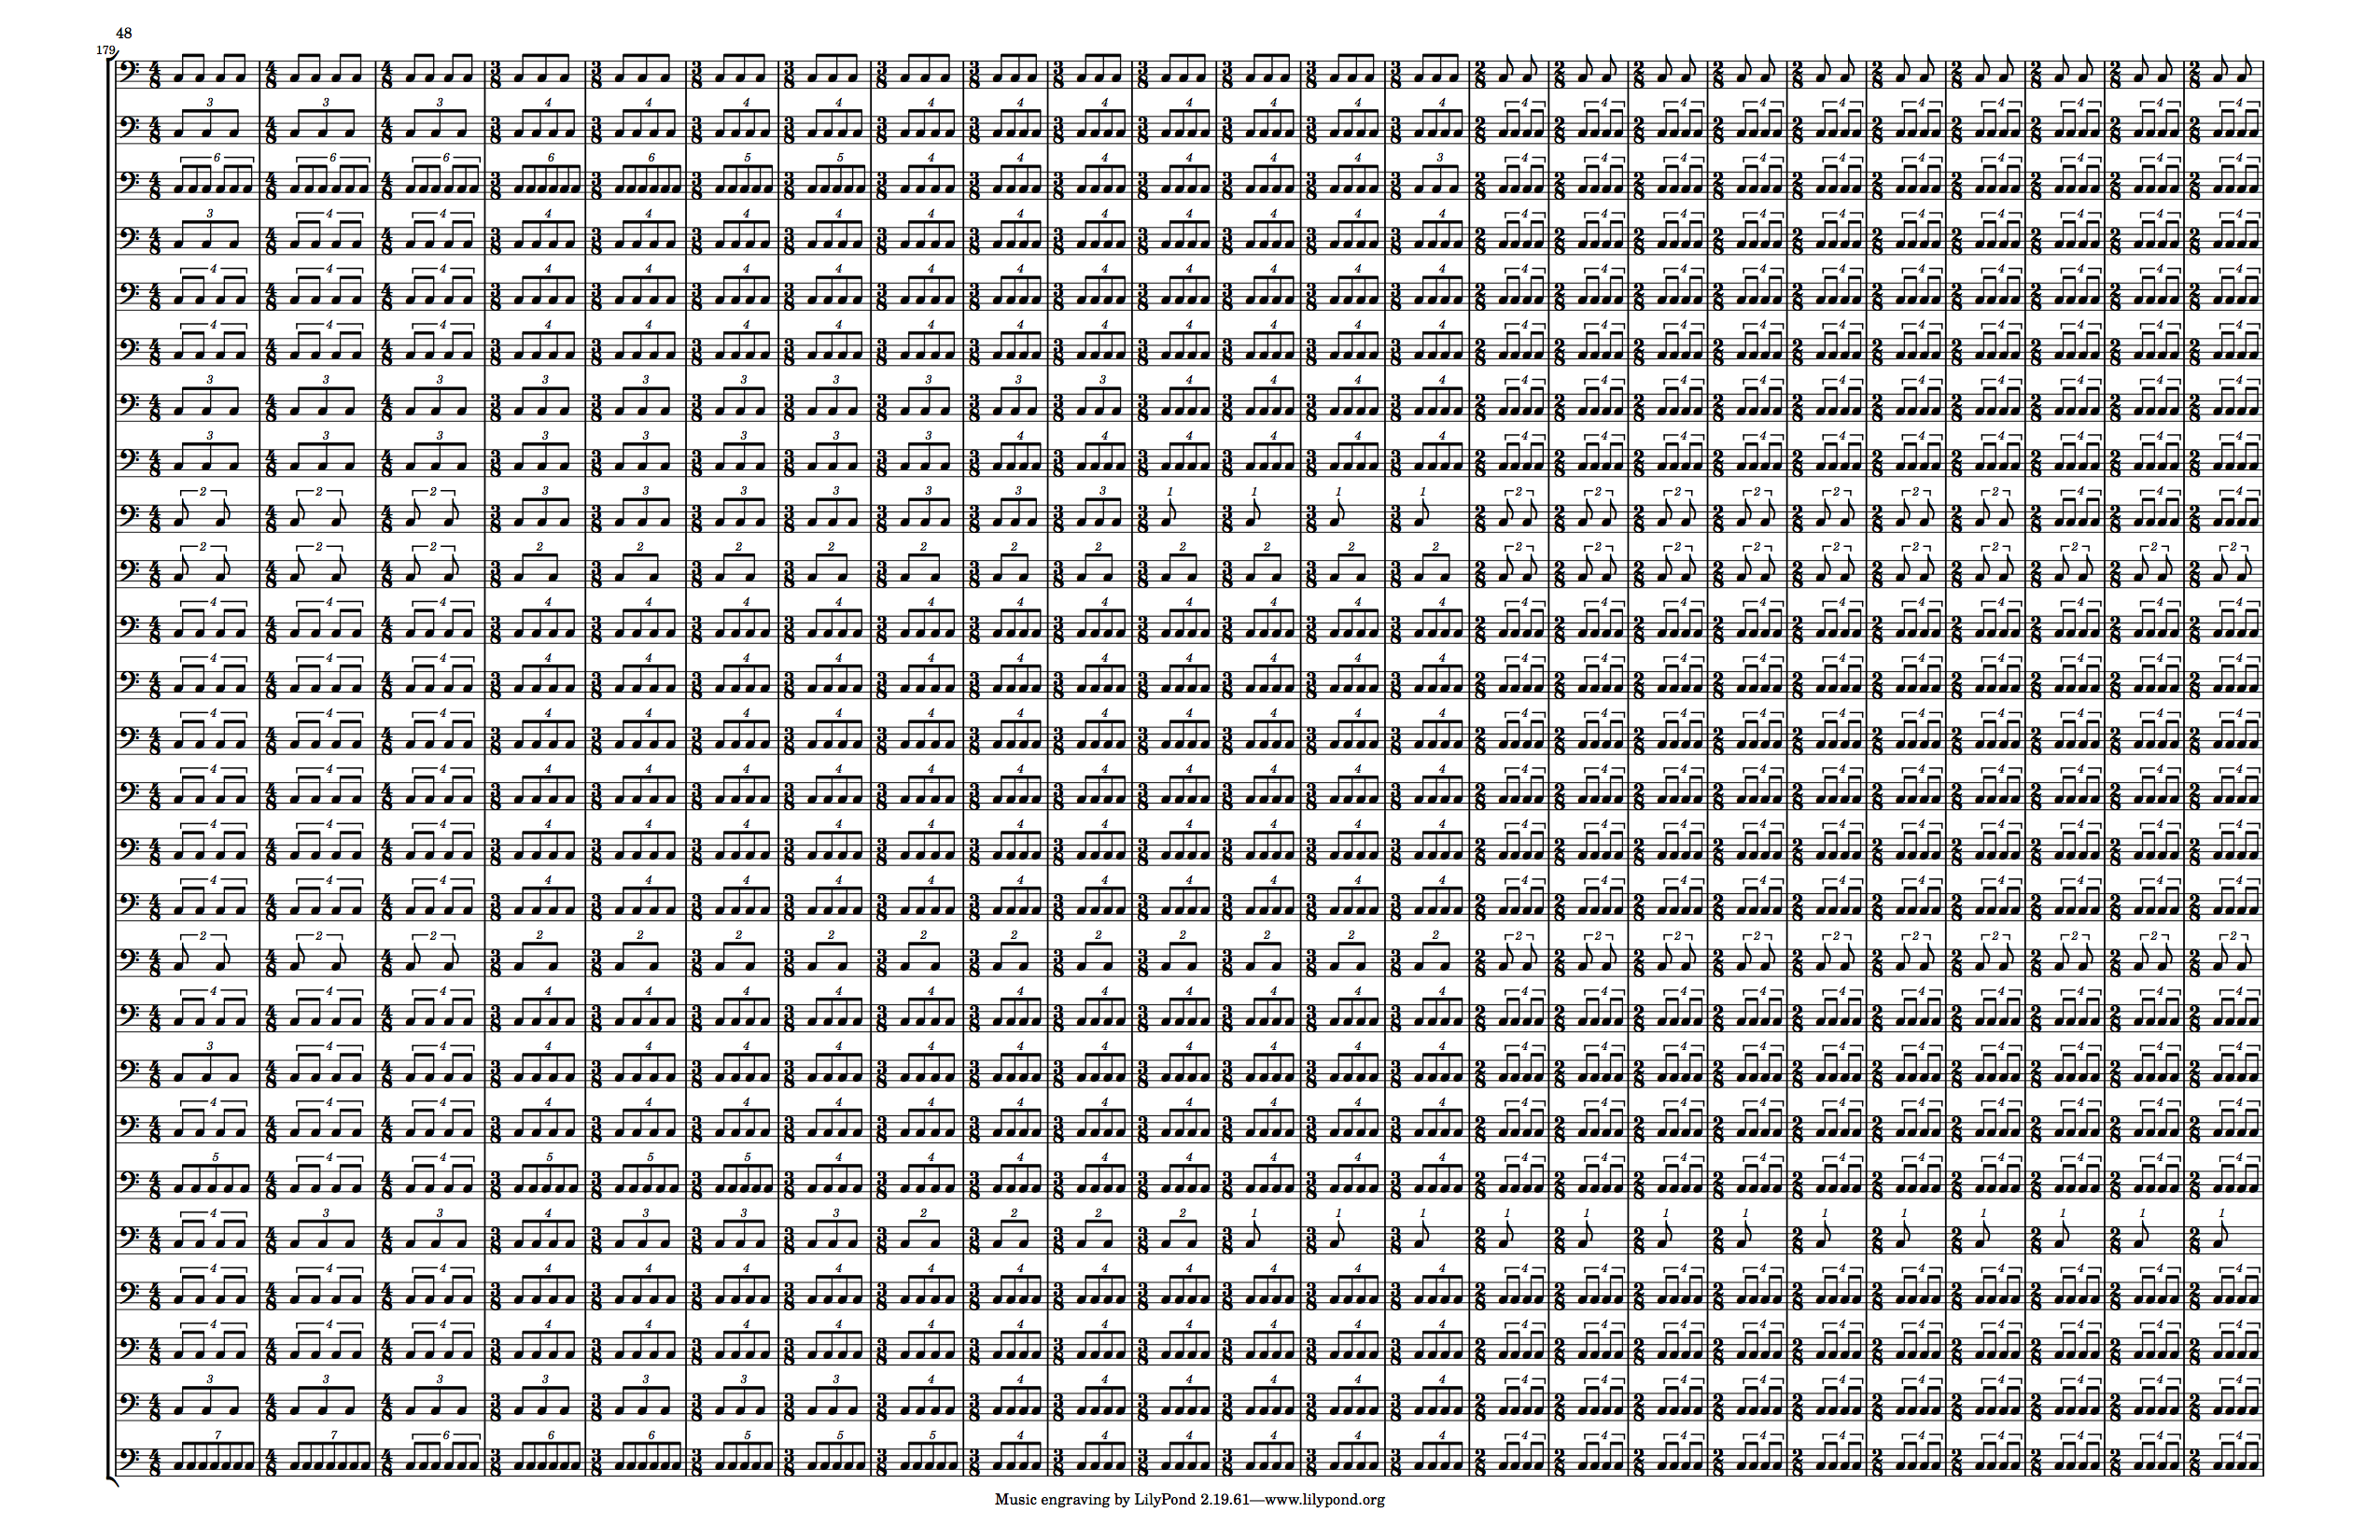
Looking at the generated base score
there are just a lot of note events. This is likely to provide exhausting for the singers and quite probably the audience as well. My first thought is to use the overall letter frequencies to provide some level of thinning on each part so that the final note density for the part reflects the overall frequency of the letter in the English language.
Let’s take a look at those frequencies:
def frequencies do
  %{
    "e" =>	12.702, "t" =>	9.056, "a" =>	8.167, "o" =>	7.507,
    "i" =>	6.966, "n" =>	6.749, "s" =>	6.327, "h" =>	6.094,
    "r" =>	5.987, "d" =>	4.253, "l" =>	4.025, "c" =>	2.782,
    "u" =>	2.758, "m" =>	2.406, "w" =>	2.360, "f" =>	2.228,
    "g" =>	2.015, "y" =>	1.974, "p" =>	1.929, "b" =>	1.492,
    "v" =>	0.978, "k" =>	0.772, "j" =>	0.153, "x" =>	0.150,
    "q" =>	0.095, "z" =>	0.074
  }
end
Here’s my first pass for a verbal explanation of how I want thinning to work:
- if
frequencyis >= 1, roundfrequencytofand convert everyfth note in the part to a rest - if
frequencyis < 1, round1 / frequencytofand convert every note at an index whereindex % f!= 0 to a rest
Let’s see what those results look like:
def converted_frequencies do
  %{
      "a" => {8, 9}, "b" => {1, 2}, "c" => {2, 3}, "d" => {4, 5},
      "e" => {12, 13}, "f" => {2, 3}, "g" => {2, 3}, "h" => {6, 7},
      "i" => {6, 7}, "j" => {1, 7}, "k" => {1, 1}, "l" => {4, 5},
      "m" => {2, 3}, "n" => {6, 7}, "o" => {7, 8}, "p" => {1, 2},
      "q" => {1, 11}, "r" => {5, 6}, "s" => {6, 7}, "t" => {9, 10},
      "u" => {2, 3}, "v" => {1, 1}, "w" => {2, 3}, "x" => {1, 7},
      "y" => {1, 2}, "z" => {1, 14}
  }
end
Ok, for the most part that looks good. The only iffy parts are the value of {1, 1}
for k and v. Because those frequency floats are so close to 1, the rounding makes it
so that every note for these should sound, despite having lower frequency than e, where
only 12 out of 13 notes sound. I played around with adding extra conditions to the if
clause to generate better values, but in the end, the easiest solution was just to hard code
those values as {1, 3}, which I picked because it’s close to {1, 2} which is the ratio
for frequencies just above 1.0 while still being a bit thinner, but still a greater
frequency than j’s {1, 7}.
Implementing frequency thinning
Up until now the code has been generating each measure as a string containing code for a LilyPond tuplet.
"\\time #{c}/8 \\repeat unfold #{c} { c8 }"

"\\tuplet #{c}/#{pulse_count} { \\repeat unfold #{c} { c8 } }"
This has been fine when every part is a constant stream of notes, but when we want to start introducing rests, it becomes insufficient. Since we are replacing notes with rests in a repeating modulo pattern, we need to start treating each note as its own entity, and we need to be able to construct a full list of every note in a part so that we can insert rests at the calculated indices. This requires us to be able to handle the notes both as a flat list of events, while also keeping them grouped into measure-length tuplets.
def raw_letter_part(letter, pulse) do
  pulse_coords = ordered_coordinates(pulse) |> Enum.into(%{})
  music = part_ratios(letter, pulse)
  |> Enum.map(fn {i, r} ->
    pulse_count = pulse_coords[i]
    c = round(r * pulse_count)
    { {c, pulse_count}, Stream.cycle(["c8"]) |> Enum.take(c)}
  end)
end
Here, instead of returning a LilyPond string, I’m returning a list of tuples of the form
{ {tuplet_numerator, tuplet_denominator}, correct_length_list_of_eight_notes}Now we can loop through that list, along with the correct modulo, keeping a running index, and return a list of processed tuplets, which can then be collected into strings.
defmodule PolyrhythmGenerator.V5 do
  ...
  def processed_letter_part(letter, pulse) do
    raw_part = raw_letter_part(letter, pulse)
    modulo_tuple = Map.get(converted_frequences, letter)
    process_part(raw_part, modulo_tuple)
  end

  # Take the necessary arguments and call to another version of the function
  # with the index and measure accumulator added on
  def process_part(raw, modulo), do: _process_part(raw, modulo, 0, [])

  # A common Elixir paradigm:
  # 1. Iterate through your list with an accumulator
  # 2. Pattern match on the function parameters and return your accumulator if
  #     if your list is empty.
  def _process_part([], _, _, processed), do: Enum.reverse(processed)
  # 3. Otherwise, process your list item, push it to the accumulator, and recurse

  # if the frequency tuple matches `{1, m}` (i.e. the frequency is < 1,
  # the note event sounds every `m` events
  def _process_part([raw|rest], modulo = {1, m}, index, processed) do
    with {tuplet, notes} <- raw do
      processed_measure = Enum.with_index(notes, index) |> Enum.map(fn {c, i} ->
        case rem(i, m) == 0 do
          true -> "c8"
          false -> "r8"
        end
      end)
      new_index = index + length(notes)
      _process_part(rest, modulo, new_index, [{tuplet, processed_measure}|processed])
    end
  end

  # if the frequency tuple doesn't match `{1, m}` (i.e. the frequency is >= 1,
  # the note event is converted to a rest only every `m` events
  def _process_part([raw|rest], modulo = {n, m}, index, processed) do
    with {tuplet, notes} <- raw do
      processed_measure = Enum.with_index(notes, index) |> Enum.map(fn {c, i} ->
        case rem(i, m) == n do
          true -> "r8"
          false -> "c8"
        end
      end)
      new_index = index + length(notes)
      _process_part(rest, modulo, new_index, [{tuplet, processed_measure}|processed])
    end
  end
  ...
end
For now I’m not applying this to the pulse parse, because I do want there to be a constant pulse, even as I disrupt the constancy of the other parts.
Now we need a way to bring this back to LilyPond. With some more pattern matching this is easy enough:
defmodule PolyrhythmGenerator.V5 do
  ...
  def pulse_part_to_lily(letter) do
    part = letter |> raw_pulse_part
    |> Enum.map(fn { {n, d}, notes} ->
      "\\time #{n}/#{d} #{Enum.join(notes, " ")}"
    end) |> Enum.join("\n")
    write_lilypond_file(letter, part)
  end

  def letter_part_to_lily(letter, pulse) do
    part = letter |> processed_letter_part(pulse)
    |> Enum.map(fn { {n, d}, notes} ->
      "\\tuplet #{n}/#{d} { #{Enum.join(notes, " ")} }"
    end) |> Enum.join("\n")
    write_lilypond_file(letter, part)
  end
  ...
end
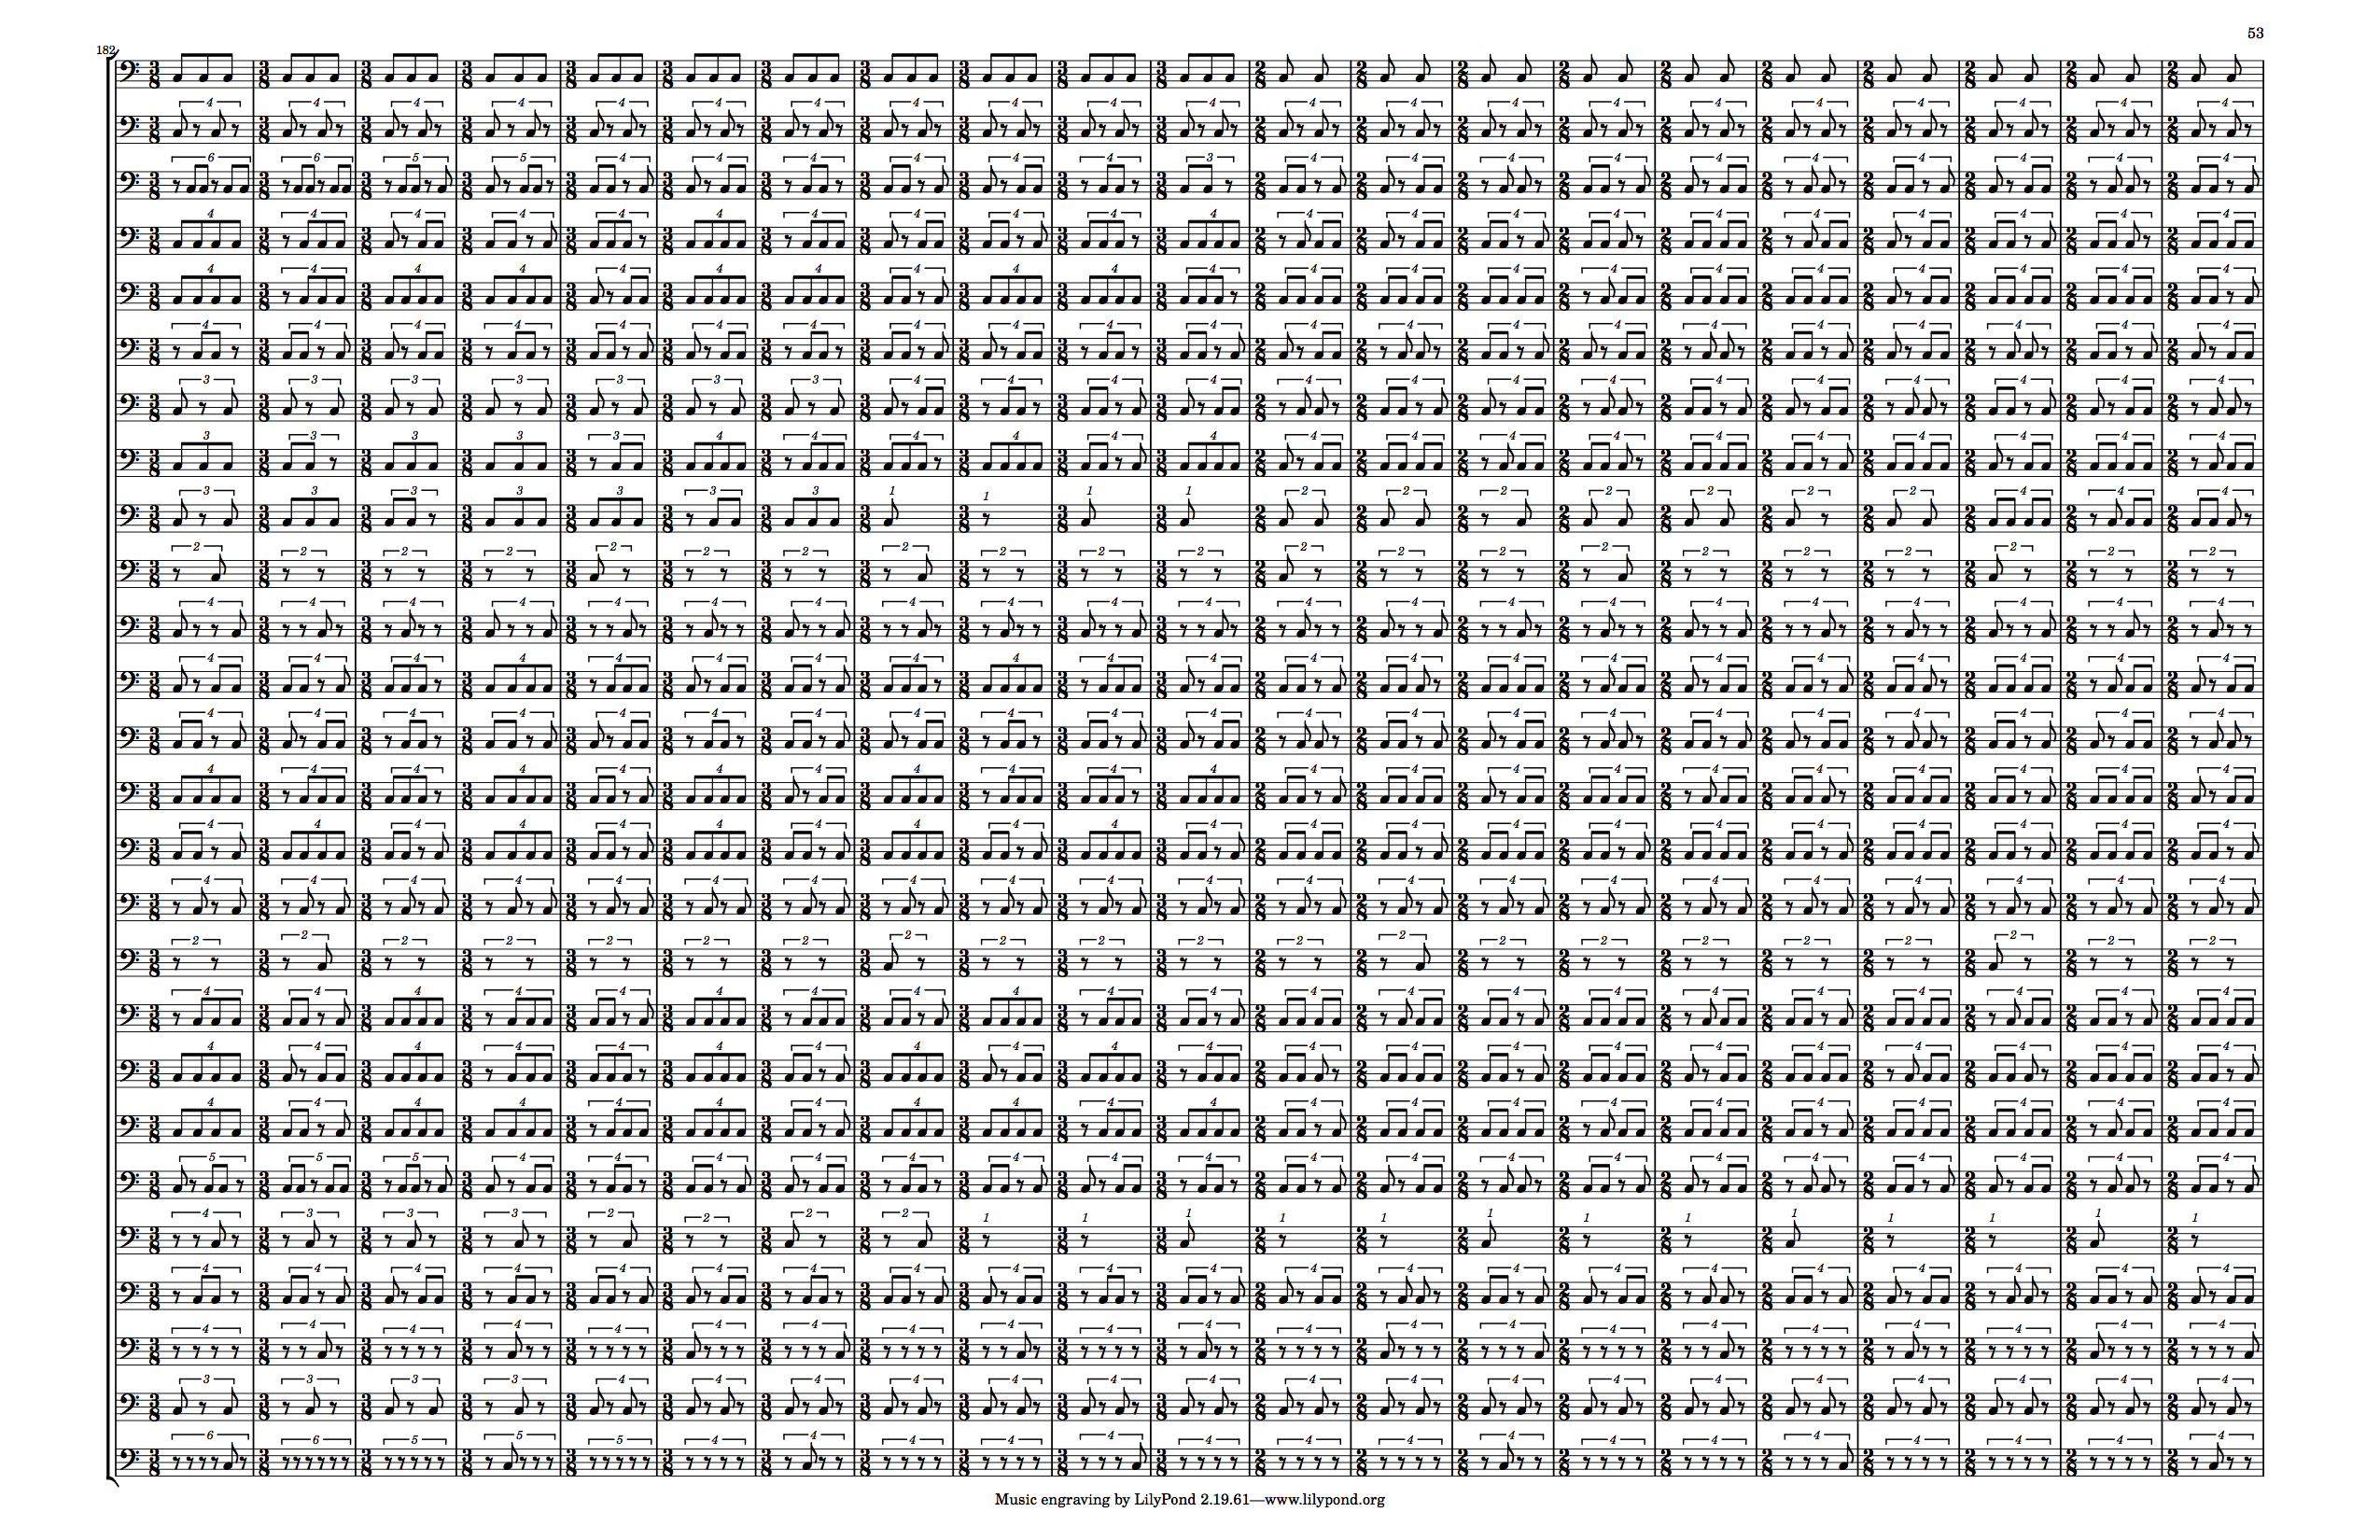
And this gives us:
Hey! I’m starting to really like this. We’ve still got the pulse, and the fun polyrhythms, but there’s a bit of breath to break up the heavy down beats and provide more variation in the texture of the parts. If you look closely there’s definitely some cleanup to be done in terms of how the tuplets are drawn, which will require additional LilyPond massaging, but for now, with our rhythms turned into constant pulses into something with a little more variation, it’s time to move on to pitch considerations.
Thanks for reading! If you liked this post, and want to know when the next one is coming out, follow me on Twitter (link below)!


