Alphabet Project, Part 1
The Idea
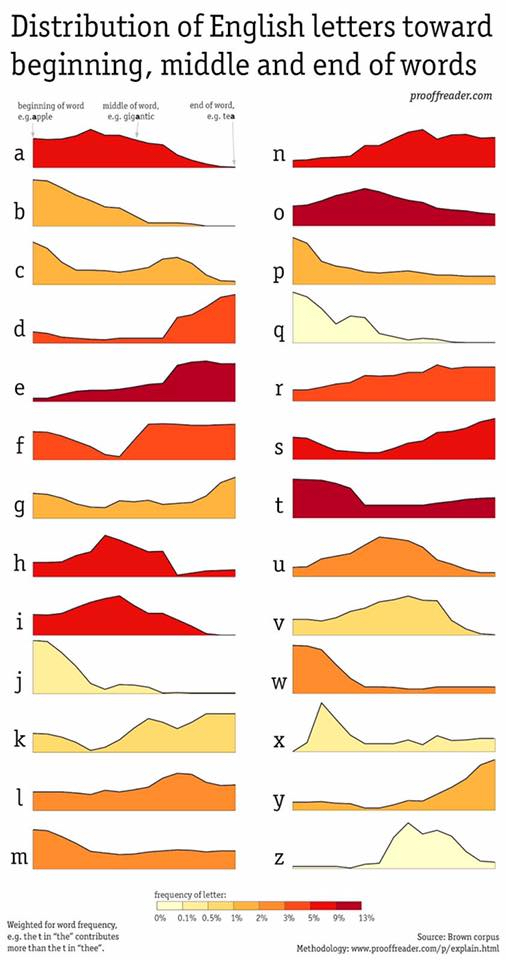
A little while ago, my friend posted this amazing picture to Facebook:
A long thought process followed, but it ended with a thought that boiled down to
What if I took these charts, converted them to coordinate sets, and wrote
a 26-part vocal piece in which each performer was assigned a phoneme for
a letter of the alphabet and they recited their phonemes in rhythms
that matched the relative frequencies for each point on the X axes?
For example, if A appears at the beginning of a word twice as often as B and
three times as often as D (which they don’t but it makes the example shorter),
the opening of the piece would have one vocalist repeat /æ/ 6 times, another repeat
/b/ three times, and a third vocalist /d/ twice.
Obviously there’s a rather long line between a .jpg on Facebook and a complete musical composition, but broken down into what I hope are manageable (and discretely bloggable) steps, it looks something like this:
- extract the 26 charts from the original image
- convert each chart into a coordinate set
- parse the 26 coordinate sets into a set of polyrhythms for each point on the X axis
- determine the musicality of the resulting polyrhythm sets and add dynamics/pitches/vowel sounds to the phonemes
- ???
- profit
And what better place to start that at the beginning?
Step 1 - extract the 26 charts from the original image
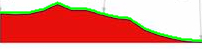
This was easy enough. Using the wonderful Acorn image editor, I was able to crop and extract the graphs into 26 images of identical width (important for generating identically sized coordinate sets for each letter).
I ended up doing this manually with a lot of cropping and copying and pasting and exporting. There may well be easier ways to do this – processing the image, detecting horizontal swathes of blank space of a certain height, and splitting the image at them – but this didn’t actually take that long, and it wasn’t the most interesting problem to solve in this project. I ended up with 26 images that looked similar to this:

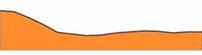
Simple enough. On to step 2.
Step 2 - convert each chart into a coordinate set
I was looking forward to this step. I’ve played around with Processing some in the past, often as a canvas for attempting to build mazes out of the texts from Italo Calvino’s Invisible Cities (which is a topic for a whole other blog series). The task at hand – parsing the pixels of an image to try to find the coordinates for each graph – seemed like something Processing was suited for.
A bit of experimentation later, I had what seemed like a working function to find and mark the graph line on one of the letter charts. My plan (annotated below) was to work through each vertical row of pixels and find the darkest pixel in the column (eyeballing it suggested this should be the top line of the graph).
void detectGraphLine() {
// Processing helper method to load the displayed pixels into an array named
// `pixels`. I had already sized the canvas to the size of the graph and
// printed the image to the canvas.
loadPixels();
// Iterate along the width of the image
for (int x = 0; x < width; x++) {
// Set some starting values. The highest possible color value in RGB
// is 255, so any pixel we find will be darker than that.
float lowestColorAvg = 255.0;
int yIndex = 0;
// Iterate down the height of the image
for (int y = 0; y < height; y++) {
// `pixels` is a flat array, so we need to calculate the index for the
// pixel at [x, y] (in Processing, [0, 0] is the top left pixel
// in the image)
int p = pixels[y * width + x];
// calculate the average of the RGB values for the pixel.
// If it's lower than the lowest value found so far, set this
// to the lowest value and store the yIndex we found it at
float avg = (red(p) + green(p) + blue(p)) / 3;
if (avg < lowestColorAvg) {
lowestColorAvg = avg;
yIndex = y;
}
}
// Draw a point on the image at the point found for visual confirmation
point(x, yIndex);
}
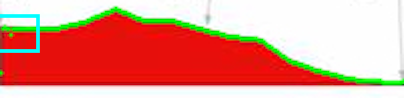
}Running this on the chart for A, we get:
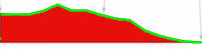
Hey! Not bad for a first try. But, if we look closely, we can see that the very leftmost green pixel is down in the middle of the graph, and over on the right the highlighted line actualy drops below the X axis.
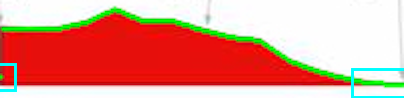
And at a few points it looks like some of the chart line is above the line we’ve drawn. This appears to be because the line on the original image is not a single color, but has a darker band in the center. I would assume this has something to do with the quality of the original image, and the subsequent, aforementioned, copying and pasting and exporting. If I knew anything about how digital graphics work, I’m sure I’d have a better explanation, but I don’t. If you do, I’d love to learn.
As it stands, these are issues that could be handled by massaging the resulting data by hand after the fact, but this has been fun, and I bet I can get Processing to do better. So let’s go.
My second thought was to take the same pixel averages as above, but chunk them into groups, find the group with the lowest average, and use the highest pixel in that chunk, but the fact that that graphs are filled in gave me some trouble with this.
I briefly played around with comparing the average of each chunk with the chunk above, looking for the first large jump in value (i.e. the switch from the white-ish space above the graph to the top of the line). And hey, look at that!
Now we just need to save the coordinates we’ve found.
// initialize a 2D array to store the coordinates
int[][] graphLine = new int[202][2];

...

void detectGraphLine() {
  ...

  // initialize a size-2 array to store the coordinate
  // and write the coordinate into the array
  int[] coords = new int[2];
  coords[0] = x;
  coords[1] = yIndex;
  // add the coordinate to the 2D array at the correct index
  graphLine[x] = coords;
}
We’re almost done, but there’s one small issue with the values we have for the Y coordinates. What we’re storing here is the distance from the top of the image to the line (remember, [0, 0] is the top-left corner). What we really want is the distance up from the X axis of the graph to that point. Of course, this means we need to find that X axis line.
We can reverse the formula we used to find the top of the graph, starting from the bottom and working up until we find a drastic change. Unfortunately, the bottom of the graph is harder to detect, since the largest color difference already occurs between the top of the graph and the blank space above it. The problem, again, stems from the impurity of the colors due to the quality of the image. What we need is a way to reduce the number of subtle shade variations in the image.
And hey, I bet we can find one of those. What if we could convert the graph image to pure black and white, making it much easier to find the edges.
void convertToBlackAndWhite() {
  loadPixels();
  // iterate through all the pixels
  for (int i = 0; i < pixels.length; i++) {
    int p = pixels[i];
    // calculate the grayscale value of the pixel
    float avg = (red(p) + green(p) + blue(p)) / 3;
    // if the grayscale value is higher than 200 (mostly white)
    if (avg > 200) {
      // make the pixel white
      pixels[i] = color(255);
    } else {
      // otherwise, make it black
      pixels[i] = color(0);
    }
  }
  // `updatePixels()` updates the display to show
  // the new values for the pixels
  updatePixels();
}
And we have:

It’s not perfect, but the bottom axis looks right, which is all we care about here. Now we can iterate up from the bottom and find the first black pixel from the bottom. Since the X axis is a straight line, we only need to find the value for one column.
void detectXAxis() {
  loadPixels();
  // iterate up the image, starting at the bottom
  // so the X axis is the first black pixel we find
  for (int y = height-1; y >= 0 ; y--) {
    int p = pixels[y * width];
    float avg = (red(p) + green(p) + blue(p)) / 3;
    // if the pixel is black
    if (avg == 0.0) {
      // print a horizontal line across the image
      line(0, y, width, y);
      // and return from the loop, since we only care
      // about the first point we find
      return;
    }
  }
}
There we go!
Now the last step is to combine everything we’ve done above into the final coordinate set.
We know the Y value of the bottom of the graph, so for each coordinate in the graph line we can subtract from it that Y value to get a value we can graph on a standard Cartesian graph:
[
  [0, 30], [1, 30], [2, 30], [3, 30], [4, 30], [5, 30], [6, 30], [7, 30], [8, 30], [9, 30], [10, 30],
  [11, 30], [12, 30], [13, 30], [14, 30], [15, 30], [16, 30], [17, 30], [18, 30], [19, 30], [20, 30],
  [21, 30], [22, 30], [23, 30], [24, 30], [25, 30], [26, 30], [27, 30], [28, 30], [29, 30], [30, 30],
  [31, 31], [32, 31], [33, 31], [34, 31], [35, 32], [36, 32], [37, 32], [38, 32], [39, 33], [40, 33],
  [41, 33], [42, 33], [43, 33], [44, 34], [45, 34], [46, 35], [47, 35], [48, 36], [49, 36], [50, 37],
  ...
]
Now we just do that 25 more times, and we’ll be back next time to start turning this into music!
Thanks for reading! If you liked this post, and want to know when the next one is coming out, follow me on Twitter (link below)!